| (1) |
were ![]() denotes implantation time,
denotes implantation time, ![]() beam area and
beam area and ![]() is the charge per ion. Typical beam currents and implantation
doses range from
is the charge per ion. Typical beam currents and implantation
doses range from
![]() and
and
![]() .
The lowest energies used start at the sub
.
The lowest energies used start at the sub ![]() area for
ultrashallow junctions to the
area for
ultrashallow junctions to the ![]() range for deep wells.
range for deep wells.
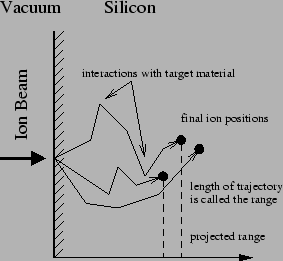
When the ions enter the substrate they continously loose
energy and change direction by collisions with the target
atoms (see also fig. ![[*]](crossref.png) ). Due to the random nature
of the collisions the total distance travelled (range)
and its projection on the direction parallel to the ion beam
(projected range) are random variables.
). Due to the random nature
of the collisions the total distance travelled (range)
and its projection on the direction parallel to the ion beam
(projected range) are random variables. ![]() denotes the
projected range, the depth were most ions stop. The
projected straggle
denotes the
projected range, the depth were most ions stop. The
projected straggle
![]() describes the
statistical fluctuation of
describes the
statistical fluctuation of ![]() .
.
back to www.gs68.de
Other important things: Legal Notice, Contact us
Copyright © 2001-2012 Spitzlsperger Technologies GmbH